Steal your face is a Grateful Dead trope circa 1970. I don’t know, US Blues? It’s the dead head sticker on the Cadillac— someone wrote recently that Shoreline Amphitheatre is designed as a steal your face. Hadn’t noticed. Not stoned enough.
meanwhile it turns out that a startup in nearby Sunnyvale near Shoreline near Levi’s where the Dead-ish played, reports scraping data on 20 million artists or their fans with the following findings (which I haven’t actually read):
SUNNYVALE, CA (edit) — Chartmetric is working to assist artists, songwriters, and others in the music and entertainment industry to improve their well-being during this pandemic by providing analytical data on the effect COVID-19 is having on music consumption across the world.
Guest post by Rutger Ansley Rosenborg, Jason Joven, and Nuttiiya Seekhao of Chartmetric
To help address the global music industry’s concerns about the COVID-19 pandemic, US-based music analytics company Chartmetric is continuously monitoring 2M+ artists across 20+ streaming and social media data sources.
We hope our data-driven analysis of COVID-19’s effects on music-related consumption helps artists, songwriters, labels, agencies, distributors, and other entertainment-related entities sustain and improve their well-being during these unprecedented times.
South Korea: Top 100 Artist YouTube consumption tended to have an inverse relationship with both coronavirus cases and web interest, indicating Koreans traded music for information as infections peaked. However, as a result of effective testing and tracing, the country rebounded quickly to normalcy on all fronts.
Italy: Daily videos views for the Top 100 Italian artists dropped as infections increased but quickly rebounded with quarantine, generally following the infection curve from there.
United States: The US Top 100 YouTube artists surged during lockdown, but as daily infections continued to rise, that demand failed to keep pace, perhaps because consumers turned to other non-music content or other sources of entertainment as the reality of sheltering in place indefinitely started to set in.
South Africa: Web- and YouTube-based interest in coronavirus correlated with a late-March spike for both daily infections and also daily Top 100 Artist YouTube views. Unlike other countries, for South Africa, music and information seemed to go hand in hand on YouTube during COVID-19.
Brazil: Once the celebratory period of Carnival died down for Brazil, the coronavirus crisis started to become real for the country, and Top 100 Artist YouTube consumption started increasing, followed by a slow decline for the next month — a decline, unfortunately, that’s not mirrored by daily infections, which numbered close to 6K by the end of April.
India: There was a striking decline in Top 100 Artist YouTube consumption here, perhaps a result of national school closures — or maybe because of over-the-top (OTT) mediums and news taking attention away from the YouTube platform altogether.
What we found was that global quarantine and social distancing measures appeared to be widening listenership for Classical, Ambient, and Children’s; narrowing listenership for Latin, Rap, Rock; and having less of an effect on Pop, Country, and Dance. The inflection point for these changes seemed to be happening around mid-March, correlating with a global peak in interest in “coronavirus” and lockdown orders going into effect in major markets like the United States.
Yet despite the success of audio-based streaming, Google’s video-sharing website YouTube stands as the second most visited website in the world, and one of the world’s primary sources for music consumption. According to the International Federation of the Phonographic Industry (IFPI), on-demand video streaming, of which YouTube makes up the vast majority, accounted for 47 percent of global on-demand music streaming. Premium audio-based streaming accounted for 37 percent, and free audio-based streaming accounted for just 15 percent.
As if that weren’t enough, YouTube’s market share is likely increasing even more as a result of quarantined consumers shifting their attention toward mediums that require multisensory engagement.
YouTube Consumption by Country During COVID-19
To better understand YouTube music consumption during COVID-19, our strategy was to look at a diverse subset of countries, both in terms of their representativeness of a certain region and also how differently COVID-19 lockdowns affected each in March and April.
Search portal Google and its subsidiary YouTube established themselves as the 1st and 2nd most visited websites in the world in 2018. (Source: Data Is Beautiful)
To select the group of artists we wanted to examine from each country, we recorded the Top 100 artists, in terms of YouTube video views during the week of Feb. 28-March 5, 2020, for each of the six markets we chose: South Korea, Italy, United States, South Africa, Brazil, and India. We attempted to focus on an international collection of music markets that also presented an assorted set of lockdown stories.
We then analyzed how their daily video views changed from the beginning of Jan 2020 to the beginning of April in order to get a better understanding of how different COVID-19 timelines and different cultural considerations impacted consumption behavior on YouTube for each country. We used the same “normalized average” calculation to best detect the YouTube music trends of each market, you can read our explanation of that trend-focused methodology in Part 1. (Note: Where applicable, we removed seasonality for the “weekend bump” in views that most music content experiences on YouTube to focus on the overall trend.)
Combining this data with coronavirus infection data from the World Health Organization, we found a diverse set of music market stories.
South Korea (No National Lockdown)
South Korea has been lauded for being one of the only countries in the world to effectively “flatten the curve,” or to level off the exponential infection rate of COVID-19. According to The Guardian, South Korea’s first case of infection was reported on Jan. 20, 2020, and for the next month or so, daily infections stayed in the single digits. By the end of February, infections ramped up to a daily peak of around 900; however, by mid-March, infections were already down to a daily range of 100-200. By mid-to-late April, the daily infection rate had gone back down to single digits.
South Korea’s testing and contact tracing are to be credited for the turnaround, though there were certainly some data privacy tradeoffs involved with this strategy, as much of the tracing data was generated through personal mobile devices.
This makes the East Asian country a particularly interesting — you might even say, shining — example to examine with regard to the effects of COVID-19 on music consumption behavior, because in theory, South Korea should exhibit the least dramatic changes in consumption trends … or maybe not.
South Korea’s YouTube interest for coronavirus peaked on Jan 28, 2020.
Judging by YouTube-specific topic searches of “coronavirus,” interest seemed to peak in late January. In other words, interest in the pandemic on YouTube was at its height for South Korea during the height of the crisis.
So, how does this track with the way South Koreans consumed their Top 100 artists on YouTube?
South Korea’s Top 100 Artist YouTube Views trend compared to WHO’s Confirmed Daily Infections.
At the end of January, when the first cases of COVID-19 were being recorded in South Korea, we see a decline in daily video views for the Top 100 South Korean artists on YouTube, potentially as a result of Koreans favoring information over these Top 100 artists during a time of uncertainty. If we look back to our Google Trends graph for coronavirus-related YouTube searches during this time period, there seems to be an inverse relationship between daily video views for South Korea’s Top 100 artists and daily COVID-19 queries on YouTube, suggesting that South Koreans, to some extent, traded music for information on the platform during the crisis.
However, daily infection rates do remain low from late January to early-to-mid February, so daily YouTube consumption appears to rebound to about 60-70 percent of where it started in mid-January. However, once daily infections begin to rise exponentially, daily videos views fall dramatically once again.
Just after South Korea’s late February daily infection peak, daily video views for these Top 100 artists reach a four-month low by early-to-mid March. It’s at this point when testing and contact tracing start to flatten the curve for South Korea, and both daily infections and also a considerable YouTube rebound after mid-March indicate the country’s return to normalcy.
Italy (National Lockdown: March 9)
After China, Italy was really the next global epicenter of the coronavirus pandemic. According to the Los Angeles Times, things really got serious, especially for the northwestern administrative region of Lombardy (home to Milan and Bergamo) in early March, with a region-specific lockdown going into effect on March 7. Sadly, by then, it was far too late.
Looking at Johns Hopkins University’s COVID-19 Map, daily infections had broken a thousand by March 7, increasing almost every day until Italy hit its daily peak of 6.6K on March 21. At the time of writing, the country’s daily infection count has yet to dip below 2K, and its total count is 203.6K.
Italy’s YouTube interest in coronavirus peaked on March 10, 2020.
Examining Italy’s YouTube searches for coronavirus, interest seems to suggest a before and after effect, whereby YouTube interest aligns with the point in time at which lockdown measures went into effect for the entire country on March 9. In other words, the day after Italians were forced to stay home, interest in the pandemic on YouTube peaked, likely as a result of two factors, 1) many residents spending more time on the internet doing what anyone does during uncertainty: seeking out information, and 2) people turning to a more engaging platform for that information.
Italy’s Top 100 Artist YouTube Views trend compared to WHO’s Confirmed Daily Infections.
Similar to South Korea, as YouTube interest in coronavirus-queries peaked on YouTube, daily video views for Italy’s Top 100 artists tanked. It was at this point in time that daily infections accelerated rapidly, reaching their peak in late March. Interestingly, however, YouTube consumption for this Top 100 cohort of artists rebounded quickly, nearly reaching its mid-February high and then surpassing it by early April.
With daily infections still in the thousands for Italy by late April, the country hadn’t reached the same sort of normalcy that South Korea had; however, the country’s demand for its top viewed artists seemed to increase following its daily infection peak, perhaps because Italians were sheltered in place — measures that Koreans weren’t subjected to by legal mandate — and streaming their favorite artists on YouTube for comfort.
United States (State-Level Lockdowns: March 19-24)
As tragedy continued to sweep Italy in March, daily infections in the United States were beginning to climb from the low hundreds in early-to-mid March to 34.1K on April 9. As we discussed in Part 1, mid-March was really the inflection point for the country, as social distancing recommendations and lockdown measures went into effect in New York City, which was soon to become the new global epicenter.
At the time of writing, the US has around 1.1 million confirmed cases of COVID-19, making it far and away the biggest global source of COVID-19 infections and giving the country an outsized effect on the global pandemic curve, global interest in the crisis itself, and behavioral changes in music consumption.
United States’ YouTube interest in coronavirus peaked on March 12, 2020.
As far as US-based interest is concerned, American shelter-in-place measures followed peak Google Trends interest, as YouTube searches reached their apex on March 12, likely in anticipation of what states like New York knew was coming.
But in addition to being the biggest global source of COVID-19 infections, the US is also the biggest global source of YouTube consumption. According to Alexa, in the last 30 days, the US accounted for 15.4 percent of global YouTube traffic, while India was close behind at 9.6 percent, and Japan rounded out the Top 3 with 4.7 percent. Within the US, according to Pew Research, 73 percent of American adults use the video streaming platform, as of early 2019, and much of that usage goes toward music — especially during the height of the pandemic.
United States’ Top 100 Artist YouTube Views trend compared to WHO’s Confirmed Daily Infections.
Similar to South Korea and Italy, YouTube consumption for the United States’ Top 100 artists hit its low in early-to-mid March, right around the time that YouTube-based interest in coronavirus started peaking, offering more credence to the idea of there being a global inflection point for consumption around then. And one that was inversely correlated with the search for information.
From there, for the US, daily video views grew alongside daily infections, much as they did in Italy; however, where Italy’s infections taper off somewhat from late March to mid-April, American infections continue to reach new highs throughout April as Top 100 YouTube consumption drops back to its early February levels.
In other words, as lockdown measures were enacted in major metropolitan areas across the country, YouTube consumption for America’s Top 100 artists surged, but as daily infections continued to rise, that demand failed to keep pace, perhaps because consumers turned to other genres or other sources of entertainment as the reality of sheltering in place indefinitely started to set in.
South Africa (National Lockdown: March 26-27)
By late March, South Africa had quickly become the African continent’s COVID-19 epicenter, “with more than 1K confirmed cases across the country’s nine provinces,” according to the New York Times. By April 30, that number had increased to a total of 5.4K, with a record daily infection count happening that day (potentially as a result of ramped up testing).
Relatively speaking, South Africa’s infection rate has been low, thanks in large part to some of the strictest lockdown measures in the world, with regulations banning jogging, dog-walking, park-going, and alcohol and cigarette retail for its population of roughly 59 million. Those restrictions were implemented on March 26 or March 27, depending who you ask.
South Africa’s YouTube interest in coronavirus peaked on March 23, 2020.
Judging by South African YouTube search trends on Google, interest was slightly ahead of strict lockdown guidelines going into effect at the day-level but pretty much in line at the week-level, likely because President Cyril Ramaphosa announced the measures on March 23, and South Africans knew what was happening around the world would likely start to happen there too.
According to Business Insider South Africa, YouTube is the second most active social media platform, with 84 percent of South African internet users depending upon it, making peak coronavirus interest on the platform on the date of President Ramaphosa’s lockdown announcement particularly interesting as a correlate to the music being streamed on YouTube at that point in time.
South Africa’s Top 100 Artist YouTube Views trend compared to WHO’s Confirmed Daily Infections.
Perhaps more than any of the other countries we’ve examined so far, peak consumption for South Africa’s Top 100 artists on YouTube just about coincides with the country’s peak daily infections in late march. From there, however, consumption declines to early March levels as daily infections rise but remain notably low compared to every other country we’ve examined.
Interestingly, it also seems, in the case of South Africa, that YouTube-based interest in coronavirus correlates with that late-March spike for both daily infections and also daily YouTube views. Unlike other countries, for South Africa, it looks like music and information go hand in hand on YouTube during COVID-19.
Beyond being one of the most COVID-ravaged countries in Latin America, Brazil is also one of the most digitally engaged, with an average of 9.5 hours spent on the internet by users aged 16 to 64 … every single day. Much of that internet usage goes to YouTube, which is, again, the No. 2 most trafficked website in the nation, next to Google itself.
Brazil’s YouTube interest in coronavirus peaked on March 17, 2020.
As far as “coronavirus” interest goes on Brazil’s No. 2 most trafficked website, there seems to be a clear correlational peak from March 15 to March 21. Like the US, Brazil is a democratic federal republic composed of many different autonomous states operating under the purview of a central executive, i.e., the president, so pinpointing one moment of national lockdown is complicated by President Bolsonaro’s reticence to acknowledge the pandemic.
That said, Brazil’s southernmost states, Santa Catarina and Rio Grande Do Sul, were some of the country’s first to institute quarantine and social distancing directives, and that happened on March 17 and March 19, respectively. Meanwhile, Brazil’s largest state, São Paulo, enacted a shutdown on March 24, which was announced on March 21. Both of these key lockdown dates more or less coincide with the nation’s peak week of interest, but unfortunately, not with peak daily infections, which have continued to climb exponentially, reaching 7.5K on April 30.
With some Brazilians staying home in late March and well into April, but others living in a state of uncertainty, YouTube consumption for the country should, theoretically, show somewhat of a delayed trend, relative to other countries.
Brazil’s Top 100 Artist YouTube Views trend compared to WHO’s Confirmed Daily Infections.
By and large, Brazil’s consumption of its Top 100 artists on YouTube actually looks quite similar to the other countries’ trends, with a fall, a rebound, and another fall. However, Brazil’s biggest decline happens in late February, before any confirmed infections are reported and long before the pandemic begins to have a measurable effect on the country.
The starting pattern here is somewhat of a mystery, as the first confirmed case of COVID-19 doesn’t occur until Feb. 25 (after the decline starts), coronavirus-related information searches on Google and YouTube don’t reach any notable peaks until mid-March, and only some state-level lockdowns happen in Brazil at all — and not until mid-to-late March. It’s worth noting, however, that Brazil’s Carnival, arguably the largest festival in the world, took place Feb. 21-26 this year, lining up almost exactly with this decline in Top 100 consumption and offering a potential cultural explanation for the anomaly: Brazilians were out celebrating during that five day stretch and not at home streaming music on YouTube.
Once the celebratory period dies down for Brazil, the coronavirus crisis starts to become real for the country, however, and Top 100 YouTube consumption begins its incline, followed by a slow decline for the next month — a decline that is, unfortunately, not mirrored by daily infections, which continue to climb at the end of April.
India (National Lockdown: March 24)
India, a world encompassing 1.38 billion people (4x the US population), is hard to conceive of as just a “country.” Second only to China in population size, Indian Prime Minister Narendra Modi enforced the country’s first-ever national lockdown on March 24, asking all 28 states and eight union territories to remain in quarantine until May 18.
Regarding its Internet use, India’s reliance on Google and YouTube would be an understatement. More than 98 percent of the country’s internet-connected population relies on Google for its search needs (more than the US at 88 percent), while 93 percent of its digital video viewers prefer YouTube over other providers.
India’s YouTube interest in coronavirus peaked on March 21, 2020.
India’s love of YouTube is further reflected in the fact that coronavirus-related YouTube searches peaked several days before the country’s March 24 lockdown but had been ramping up since late February, remaining relatively substantial well into early April.
Regarding its YouTube music presence, India simply dwarfs any Western conception of music streaming consumption: Famous Indian playback singer Alka Yagnik earned 240 million YouTube views (No. 1 in India) across her entire catalog in one week (April 17-23). American rapper YoungBoy Never Broke Again was No. 1 in the United States in the same week and earned less than a quarter of that amount (54 million). Bad Bunny (No. 5 in the US) did 13 percent of that, and Billie Eilish (No. 16 in the US) did 8 percent. On YouTube, Bollywood singers don’t just top the West’s biggest stars: They are in their own league altogether.
India’s Top 100 Artist YouTube Views trend compared to WHO’s Confirmed Daily Infections.
Looking at India’s averaged YouTube Views of its Top 100 artists, we see movement that is most likely correlated with the country’s COVID-19 lockdown: A stark 75 percent drop in views from the top of March until the end of April. But the seemingly “early” YouTube consumption drop proves that national lockdown (March 24) isn’t the only major factor to consider.
Coronavirus-related travel screenings, visa restrictions, and Bombay Stock Exchange reflections likely kicked up public awareness in early March, contributing to the initial decrease in market YouTube views for music content. But beginning around March 16 and ending around March 27, we see the largest fallout (around 60 percent) so far in 2020.
Our initial guess to this 11-day phenomenon was India’s nationwide closure of all schools and universities on March 16. With many of India’s young adults likely dispersing from university city campuses to their family’s homes, this could contribute to the initial change in music-related YouTube behavior (e.g., social distancing equals less get-togethers with music.)
However, now that upstart telecommunications provider Jio Reliance has shaken up the Indian mobile data scene since 2016 with nearly-free 4G access, the issue may actually be more related to over-the-top (OTT) mediums and news taking attention away from the YouTube platform altogether. Publicis Groupe India reported a 34 percent increase in “entertainment and OTT” within the first three weeks of March, which would make sense with everyone at home spending more time with their smart TVs, gaming consoles and other streaming devices. True to the news trends in other countries we’ve discussed, it additionally reported a 61 percent increase to “mainline” online news content between March 16-22, and a 50 percent increase in regional news content, both compared to a month earlier.
(Thanks to Aniket Rajgarhia at Outdustry for the local insight.)
Lockdown Blues Are Somehow in Lockstep
Knowing how each country’s lockdown narrative has played out, comparing their YouTube consumption trends, based on an average of their Top 100 artists, reveals an unexpectedly conformed set of trends.
Caption: A interactive, international comparison of each market’s averaged Top 100 artists (by YouTube views) from January to April 2020.
The obvious outlier here is India, which tracks with most of the group until experiencing a precipitous decline starting around March 16. Though peaking at the beginning of March, India’s Top 100 consumption dropped to 25 percent of that peak by the end of April. (Note: These are normalized trends, and not total consumption. India still more than doubles the US’ Top 100 artists’ views at 3 billion vs. 1.3 billion, respectively.)
It’s worth mentioning that the Indian music industry is a different animal than most Western markets. Indie has been tightly bound to the production of Bollywood films and the “playback” singers that voice the lead actors who lip sync in the movies themselves.
Though the rise of what’s called “non-film” music has begun to evolve the Indian music scene past its Bollywood origins, playback singers still rule the roost on YouTube, with the most recent Top 10 artists (totaling 1.1 billion views that week) all being playback singers. Unfortunately, Mumbai’s movie machine has ground to a complete halt, cutting off the pipeline of films and, as a result, its music work. So, while university students may be one reason for India’s March 16 decline, its April 18 decrease may correlate with a lag in the production of new content.
Save for perhaps Brazil’s likely Carnival-fueled decline in late February, generally speaking, the other five markets we examined are surprisingly in lockstep with one another, with an early-to-mid March dip in consumption followed by a rebound to normalcy. Each country might be experiencing — and reacting to — the COVID-19 pandemic in its own way, but its effect on all aspects of our lives is truly global.
(Methodology note: Each country’s Top 100 chart was different at the beginning of 2020 and potentially even more varied by the end of April. While this opens up the possibility for viral outliers and chart volatility, it also allows us to better track pre-coronavirus and post-coronavirus trends for the same 100 artists in each country.)
Stay tuned for our analysis of artist-level live-streaming in Part 3. You can subscribe to have it delivered to your inbox when
some people gather what another guy spills…
edit to add, later that night: ok I’ll bite. I do A & R artist and repertoire to the extent I’ve promoted 500 acts and artists and am always evaluating roughly 5,000 possible future headliners to work with. But these guys track 20 million acts. Wowee. Here’s how they do it :
Why Music Analytics Tools Matter for A&R Teams
Finding and developing new artists is really the backbone of the recording side of the music industry, but these days, discovery is less about stumbling across an unknown singer at an underground club and more about tracking the digital buzz on a hot, new track.
Historically, data hasn’t been much of a consideration for A&R teams, many of whom have relied on gut instinct, experience, and, well, taste. The difference today is the sheer amount of artists and music instantly available worldwide through DSPs (Digital Service Providers or Digital Streaming Platforms, depending who you ask). And while relying on only old methods in a new world may work, we think combining them is the best way forward.
Brief History of A&R
A&R, or Artists and Repertoire, really came into its own with the development of the recording industry. As the commercialization of the phonographramped up during the mid-20th century, the music industry was splitting from two sectors into three sectors: publishing, performing, and now, recording.
The technological disruption of recorded music at scale expanded the artist pool, because it opened up a whole other world of song interpretation and, consequently, consumption. The recording artist was born, and A&Rs were positioned to help them succeed.
Originally, the A&R role was tasked with matching artists to the right song and/or songwriter. Before the Beatles, after all, commercially viable artists who wrote their own material were pretty much unheard of.
As the album format reached full maturity with ‘60s/‘70s Rock, A&Rs were increasingly involved, in varying degrees, with every aspect of an artist’s development, from discovery to production, creative direction to career trajectory.
A&Rs weren’t just song pickers or talent scouts: They were the business-minded angels on artists’ shoulders, the bridge between the artist’s wildest creative impulses and the record label’s most stringent budgetary concerns.
But the digital revolution started to change the A&R landscape in two major ways:
Discovery wasn’t necessarily happening by chance in an underground club or through some random demo dropped in the mail. Discovery was increasingly happening on the internet through a groundswell of support from networked communities.
Development wasn’t all coming top-down from label to artist. Development could happen from the bottom-up, with artists having more opportunities to determine the trajectories of their own creative output, branding, and careers.
But as data becomes increasingly important as a supplement to gut instinct, some things have always remained consistent in A&R:
Predicting what will resonate with an audience.
Getting there first.
What A&R Looks Like Today
Today’s A&Rs are swimming in a sea of artists and an ocean of data. And that can be really discouraging, especially for a role that has traditionally privileged gut instinct over anything else.
Fortunately, being able to consume data in digestible bites can actually empower — rather than overpower — gut. In many ways, A&Rs are the creative life force of the business side of music, which is precisely what makes data analytics tools so important for A&R teams navigating the choppy waters of this new data-driven music environment.
From indie labels to major labels, A&R teams trawl this vast digital music seascape, hoping the right streaming playlist, social media platform, or music blog will catch them a couple of promising acts … out of the millions and millions of artists out there. It can be overwhelming.
How Chartmetric Can Help
In today’s music business, data analytics works really well for A&R teams as a fine mesh, filtering that sea of artists into small, observable tide pools that get you closer to the talent you were looking for all along.
Say, for example, you’re looking for an unsigned artist or band, in the Rock space, preferably from the U.S., since that’s where you’re based.
You can visit the Prediction Model within our A&R Dashboard to find more than 500 artists we’re predicting will reach varying levels of popularity on Spotify in the next week. If that seems like there’s a bit too much to go through with the 30 minutes you have for discovery today, then you can filter down to just the Rock, Punk & Metal genre, reducing this list of buzzing acts to just 152.
Uh oh, your boss just gave you a fire to put out … guess you only have 15 minutes now. Use the United States filter to whittle your list down to just five acts. Now, it’s time to listen to some fresh music while you check out each of these Artist Pages. There, you can dig into more detailed analytics to give you a comprehensive view of each artist’s story. How engaged are their listeners? What is their playlist reach to follower ratio? Are they really well in particular regions, with particular age groups, or on particular platforms? Do they need your help to diversify? In the end, hopefully you’ve uncovered an unsigned band worth reaching out to!
Who is Chartmetric?
We are a small, highly skilled team with members from diverse backgrounds, and that diversity is celebrated just as much as our work is. We’re talented solo artists, but we’re a much better band. We are as much music data rockstars as we are music superfans, and we thrive as a bridge between music and technology, data and creativity.
Sign up for a free account at chartmetric.com, dive deeper into our features at blog.chartmetric.com, and check them out for yourself. We can’t wait to see what you create.
Ed Solomon was in my Hebrew school car pool in 1973 when I was 8 and he was 11. There were a total of six of us in the car pool. Our mother’s drove. Ed made a sign that he held to the back window of the station wagon for the other driver’s to see: HONK IF YOU’RE HORNY. We had no idea what it meant but it sure was funny. Ed later did stand-up while at UCLA and then wrote “Bill and Ted’s Excellent Adventure” and “Men In Black”.
Meanwhile. I just posted 6 times at PAW about Mark Zuckerberg giving money to restauarants.
Posted by Mark Weiss, a resident of Downtown North,
1 hour ago
Mark Weiss is a registered user.
I bought $45 takeout from that same Chef Chu’s and left a $5 tip. As a percentage of my actual cash on hand, this would be equivalent to Zuckerberg giving away $100m.
The Covid-19 could be a deal-breaker for capitalism. Revolution, crime or LLCs to DAF’s and a pledge — your call, RichieRichieRichieRichie Rich.
comment Posted by Mark Weiss, a resident of Downtown North,
1 hour ago
Mark Weiss is a registered user.
There could be a dish named for him at the ramen place called Veruca Salt.
this comment Posted by Mark Weiss, a resident of Downtown North,
59 minutes ago
Mark Weiss is a registered user.
You see, there are five types of broth at Dohatsuten: Soy, Salt, Spicy Miso, Tonkotsu, Vegetarian Soy.
Whereas Veruca Salt, before it was an indie band, was a bratty rich girl in “Charlie and the Chocolate Factory” movie.
So I’m riffing on two or three pop references and calling Zuck a brat, ok?
I have a yolk about Oompa Loompas but it’s too rich for these pages.
Seether.
comment Posted by Mark Weiss, a resident of Downtown North,
48 minutes ago
Mark Weiss is a registered user.
I heard that one of the PayPaly mafia just gave a bilion dollars to Bird Dog Restaurant, the former Mandarin Gourmet the former El Dorado Mexican although it will be paid out in avocados from a special tree, one avocado per year for 125 million years — it’s an $8 avocado.
Posted by bentrick, a resident of Charleston Meadows,
41 minutes ago
bentrick is a registered user.
The Cinderella Solution is a weight loss program design specifically for women that reveals to you a simple 2 step ritual that will help you achieve weight loss. Web Link
Posted by Mark Weiss, a resident of Downtown North,
34 minutes ago
Mark Weiss is a registered user.
You know for that same $800,000 he could have turned Dan Gordon’s into a comedy club and gotten Jo Koy to play his “grand opening”
Posted by Mark Weiss, a resident of Downtown North,
29 minutes ago
Mark Weiss is a registered user.
O Brother Where Arf Thou?
(I’m riffing on my two prevoius jokes, about the ramen place and Bird Dog — “arf” is the sound a dog makes; “broth” is a play on “brother” and also a movie, two movies, one by the Coen Brothers and one by Preston Sturges. Ok?)
Posted by Mark Weiss, a resident of Downtown North,
22 minutes ago
Mark Weiss is a registered user.
Which reminds me: it was five years ago to the day that EK bid adieu to Jacquetta Lannan, who ran an upscale hot dog stand in the site of the former Know Knew Books, which i wanted her to call A Confederacy of Dunces but was actually called Chez Franc.
Coinkydinky, when I was an undergrad at Dartmouth, a wee bit before Jacquetta’s time, we used to have a yearly contest called The Smith College Weiner Queen.
Web Link
Posted by Mark Weiss, a resident of Downtown North,
19 minutes ago
Mark Weiss is a registered user.
Not only am I calling Zuck a brat, he is the wurst type.
edit to add: I have to admit that I did not just jump from Mark Zuckerberg as a bratwurst to Ed Solomon Honk if You’re Horny, but I stopped at Sean Penn as Jeff Spicoli calling Mr Hand “dick”
andand:
Actually I went to Peet’s for the first time in months, and that was 12 hours ago — -and then on my own blog I was recalling that the guy who wrote Bill and Ted’s Excellent Adventure was in my Hebrew School Carpool….I actually met Zuckerberg on the night that he commissoned David Choe to paint a mural on his first office space, above Jing Jing. I gave Choe $20 for a calendar of his art work — years later it was revealed that Choe was offered $20K cash for the mural or FB stock options which he took and made him a millonaire but I reckon that if I hadn’t come along with that $20 he might have took the cash from Zuck and shorted himself the stock options.
Meanwhile, when I tried to fact check my own story Choe had posted that the coda of the story is that the City of Palo alto had sent FB a fix-it letter claiming that FB was liable for the damages caused by Choe dripping paint on the sidewalk — so rather than Palo Alto being an incubator of tech somehow, which we sometimes claim to be, we were actually a nuisance to FB.
But I don’t use that social media — don’t want to give the broth the satisfaction of my data — and I know the difference between a 501c3 and a Donor Advised Fund via a LLC. The reason the article says that it was a gift from his personal account and not from his ZCI fund is that that fund is subject to audit, and restricted to 501c3s.
If these billionaires gave away their entire fortunes except their primary residence and tried to get by just on their wits, their contacts and their good name, I’d be impressed. But i’m not impressed with giving away a billion dollar if you got a billion dollar hole card, so to speak. hot dog!
Some one once said “I’d rather be lucky than good” — I say “I’d rather be funny than good lucking”
Try the veal.
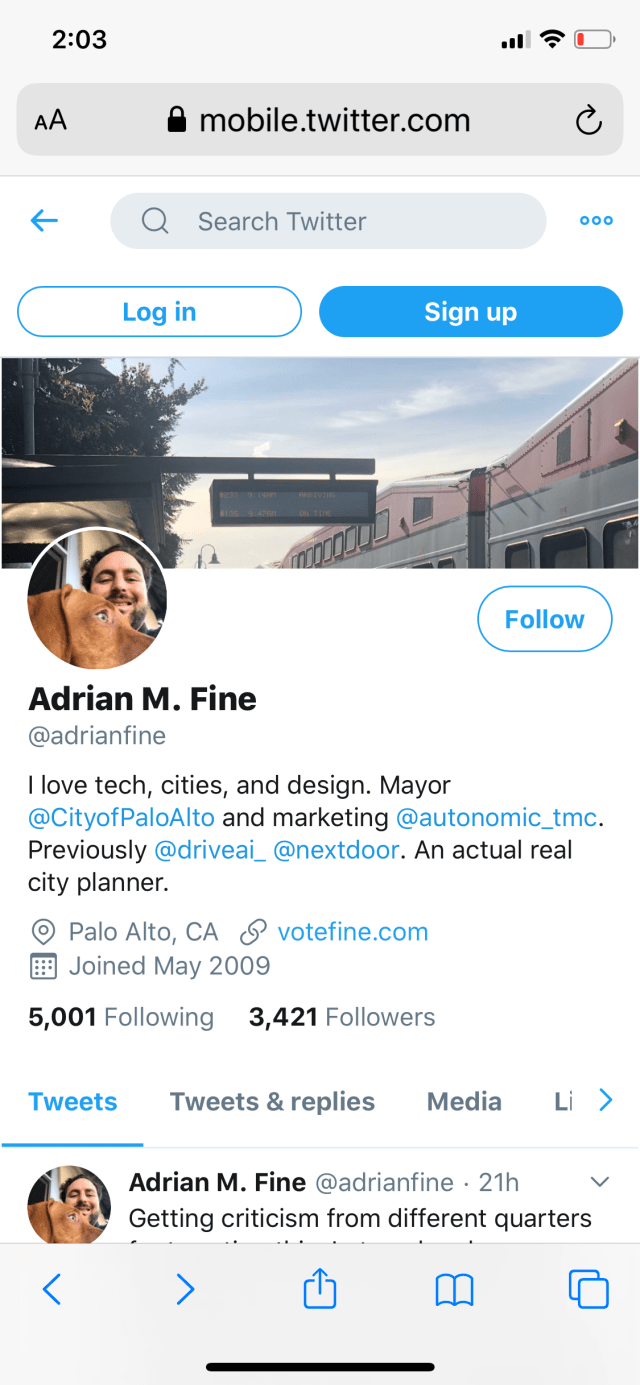
Palo Alto mayor Adrian Fine, who is in hot water this week for pledging his support for proto-Fascist CEO Elon Musk, literally references trains arriving on time on his social media home page:
Lisa Mezzacappa has a work Touching Bass featuring three bass playing musicians and three dancers.
As compared to an ESPN feature from 12 years ago about a softball player tearing her ACL and being helped or carried around the base path by the opposition — If her teammates helped her it would be an out.
it’s also sort of a dance spontaneous and ritualistic.
Touch em all.
(And it looks like there is an a sportsmanship award named for Stan Musial…)
Ok, 2018. New to me at least. I’m 56 years old, I’ve lost a step. Or worse: maybe I noted this before but don’t remember.
This is the 52nd time I’ve mentioned or featured Mac Laura Jim Jon and jack yes Jack in Plastic Alto and there might be five or six ideas therein theremin
Christgau sent me
backed with
Bw
Timo Andres composition will be in LA Phil next fall if there is an LA Phil next fall and not just more Fill fill fill. It says he is born in Palo alto which probably means the hospital which probably means somebody was at Stanford but do not call him “native Palo Altan” or let’s ask him how long he was in Palo Alto. He’s from CT.
Not long after the people on TV announced that Trump had won Pennsylvania, Jared Kushner grabbed Christie anxiously and said: “We have to have a transition meeting tomorrow morning!” Even before that meeting, Christie had made sure that Trump knew the protocol for his discussions with foreign leaders. The transition team had prepared a document to let him know how these were meant to go. The first few calls were easy – the very first was always with the prime minister of Great Britain – but two dozen calls in you were talking to some kleptocrat and tiptoeing around sensitive security issues. Before any of the calls could be made, however, the president of Egypt called in to the switchboard at Trump Tower and somehow got the operator to put him straight through to Trump. “Trump was like … I love the Bangles! You know that song Walk Like an Egyptian?” recalled one of his advisers on the scene.
bw (Michael Lewis, “The Fifth Rish” 2018)
Ramy Essam song about a date — the guy who directed the video died in prison, for dissent. His name was Shady Habash.
Kudos to Val Denn for her work on behalf of this courageous international artist.
The story.
and: I’m reprinting this from earlier today, the previous post:
Livenation meanwhile — the former Bill Graham Presents and former SFX and former Clear Channel just sold 5 percent of their equity for $500m to the sovereign wealth fund of Saudi Arabia meaning that for every $40 you spend on a future Taylor Swift show 50 cents goes towards the dismemberment with a butchers saw of a dissident or loudmouth — like me, were I a Saudi — and the ensuing coverup and two bits worth so to speak goes to prevent women there from reaching orgasm. No truth to the rumor that LiveNation is trying to coax out of retirement Dismemberment Plan. And kudos to Ari Emmanuel of Endeavor for refusing investment from the Saudi’s.
Also, and I am jumping around here there was something in the paper about Rusty Staub spelling the name wrong of the leading prize for literature and peace and saying it was for journalism. But the only time it was awarded to a journalist was 2015 for the writer from Belarus who wrote a hybrid post-modern “Proza” about things like Cherynobel victims — maybe he meant the Chernobyl Prize for Caustic Prose. Svetlana Alexievich. This thread also had me reading a column in the Post by about media control in Saudi Arabia.
andand (I’m sort of conflating news from Egypt and news about Saudi Arabia but here is a column from two years ago about MBS ownership of media, and his imprisonment, in a Ritz Hotel, of elites and family who owned these properties:
It’s understandable if one believes this to be a coordinated attack on what is already restricted space for thought and expression in Saudi Arabia, and the wider region. Yet MBS, as the crown prince is known, already controlled the public square long before he arrested family members and senior business elites last November.
MBS and his family already own the Saudi Research & Marketing Group, which includes the pan-Arab daily Al Sharq Al Awsat. Just over a year ago, there was a serious effort to merge with MBC. Differences over the final financial settlement scuttled the talks.
Over the past 18 months, MBS’s communications team within the Royal Court publicly has chastised, and worse, intimidated anyone who disagrees. Saud Al-Qahtani, leader of that unit, has a blacklist and calls for Saudis to add names to it. Writers like me, whose criticism is offered respectfully, seem to be considered more dangerous than the more strident Saudi opposition based in London. The government arrested dozens of intellectuals, clerics and social media figures over the past year, even though most are actually supportive of MBS’s reforms. Compliant journalists are rewarded with money and access to senior officials.
I wonder if management of Live Nation — especially people who worked with Bill Graham himself — feel about their work profiting the Saudi’s. I wonder if fans will care. Or the artists. Is there a way for artists to bypass Live Nation? Can LiveNation buy back Saudi stock?
Regarding the Eyptian filmmaker who shot a video that was a political satire or hatchet and then died perhaps of Covid, perhaps suicide at age 24 in an Egyptian prison, I don’t I would have the courage as a promoter to work with the artist in the video. But I’d like to hear more from his agent.
andandand– too much to digest, but I’ll come back to Sharmoofers.


 Bw
Bw Kudos to Val Denn for her work on behalf of this courageous international artist.
The story.
and: I’m reprinting this from earlier today, the previous post:
Livenation meanwhile — the former Bill Graham Presents and former SFX and former Clear Channel just sold 5 percent of their equity for $500m to the sovereign wealth fund of Saudi Arabia meaning that for every $40 you spend on a future Taylor Swift show 50 cents goes towards the dismemberment with a butchers saw of a dissident or loudmouth — like me, were I a Saudi — and the ensuing coverup and two bits worth so to speak goes to prevent women there from reaching orgasm. No truth to the rumor that LiveNation is trying to coax out of retirement Dismemberment Plan. And kudos to Ari Emmanuel of Endeavor for refusing investment from the Saudi’s.
Also, and I am jumping around here there was something in the paper about Rusty Staub spelling the name wrong of the leading prize for literature and peace and saying it was for journalism. But the only time it was awarded to a journalist was 2015 for the writer from Belarus who wrote a hybrid post-modern “Proza” about things like Cherynobel victims — maybe he meant the Chernobyl Prize for Caustic Prose. Svetlana Alexievich. This thread also had me reading a column in the Post by about media control in Saudi Arabia.
andand (I’m sort of conflating news from Egypt and news about Saudi Arabia but here is a column from two years ago about MBS ownership of media, and his imprisonment, in a Ritz Hotel, of elites and family who owned these properties:
It’s understandable if one believes this to be a coordinated attack on what is already restricted space for thought and expression in Saudi Arabia, and the wider region. Yet MBS, as the crown prince is known, already controlled the public square long before he arrested family members and senior business elites last November.
MBS and his family already own the Saudi Research & Marketing Group, which includes the pan-Arab daily Al Sharq Al Awsat. Just over a year ago, there was a serious effort to merge with MBC. Differences over the final financial settlement scuttled the talks.
Over the past 18 months, MBS’s communications team within the Royal Court publicly has chastised, and worse, intimidated anyone who disagrees. Saud Al-Qahtani, leader of that unit, has a blacklist and calls for Saudis to add names to it. Writers like me, whose criticism is offered respectfully, seem to be considered more dangerous than the more strident Saudi opposition based in London. The government arrested dozens of intellectuals, clerics and social media figures over the past year, even though most are actually supportive of MBS’s reforms. Compliant journalists are rewarded with money and access to senior officials.
I wonder if management of Live Nation — especially people who worked with Bill Graham himself — feel about their work profiting the Saudi’s. I wonder if fans will care. Or the artists. Is there a way for artists to bypass Live Nation? Can LiveNation buy back Saudi stock?
Regarding the Eyptian filmmaker who shot a video that was a political satire or hatchet and then died perhaps of Covid, perhaps suicide at age 24 in an Egyptian prison, I don’t I would have the courage as a promoter to work with the artist in the video. But I’d like to hear more from his agent.
andandand– too much to digest, but I’ll come back to Sharmoofers.
Kudos to Val Denn for her work on behalf of this courageous international artist.
The story.
and: I’m reprinting this from earlier today, the previous post:
Livenation meanwhile — the former Bill Graham Presents and former SFX and former Clear Channel just sold 5 percent of their equity for $500m to the sovereign wealth fund of Saudi Arabia meaning that for every $40 you spend on a future Taylor Swift show 50 cents goes towards the dismemberment with a butchers saw of a dissident or loudmouth — like me, were I a Saudi — and the ensuing coverup and two bits worth so to speak goes to prevent women there from reaching orgasm. No truth to the rumor that LiveNation is trying to coax out of retirement Dismemberment Plan. And kudos to Ari Emmanuel of Endeavor for refusing investment from the Saudi’s.
Also, and I am jumping around here there was something in the paper about Rusty Staub spelling the name wrong of the leading prize for literature and peace and saying it was for journalism. But the only time it was awarded to a journalist was 2015 for the writer from Belarus who wrote a hybrid post-modern “Proza” about things like Cherynobel victims — maybe he meant the Chernobyl Prize for Caustic Prose. Svetlana Alexievich. This thread also had me reading a column in the Post by about media control in Saudi Arabia.
andand (I’m sort of conflating news from Egypt and news about Saudi Arabia but here is a column from two years ago about MBS ownership of media, and his imprisonment, in a Ritz Hotel, of elites and family who owned these properties:
It’s understandable if one believes this to be a coordinated attack on what is already restricted space for thought and expression in Saudi Arabia, and the wider region. Yet MBS, as the crown prince is known, already controlled the public square long before he arrested family members and senior business elites last November.
MBS and his family already own the Saudi Research & Marketing Group, which includes the pan-Arab daily Al Sharq Al Awsat. Just over a year ago, there was a serious effort to merge with MBC. Differences over the final financial settlement scuttled the talks.
Over the past 18 months, MBS’s communications team within the Royal Court publicly has chastised, and worse, intimidated anyone who disagrees. Saud Al-Qahtani, leader of that unit, has a blacklist and calls for Saudis to add names to it. Writers like me, whose criticism is offered respectfully, seem to be considered more dangerous than the more strident Saudi opposition based in London. The government arrested dozens of intellectuals, clerics and social media figures over the past year, even though most are actually supportive of MBS’s reforms. Compliant journalists are rewarded with money and access to senior officials.
I wonder if management of Live Nation — especially people who worked with Bill Graham himself — feel about their work profiting the Saudi’s. I wonder if fans will care. Or the artists. Is there a way for artists to bypass Live Nation? Can LiveNation buy back Saudi stock?
Regarding the Eyptian filmmaker who shot a video that was a political satire or hatchet and then died perhaps of Covid, perhaps suicide at age 24 in an Egyptian prison, I don’t I would have the courage as a promoter to work with the artist in the video. But I’d like to hear more from his agent.
andandand– too much to digest, but I’ll come back to Sharmoofers. 